How Will We Build Enough Affordable Housing in Albemarle County?

As with so many data stories, it started with a chart.
The May 2025 Annual Affordable Housing report for Albemarle County includes a chart showing the estimated number of Affordable Housing Units needed by 2040 by income level.
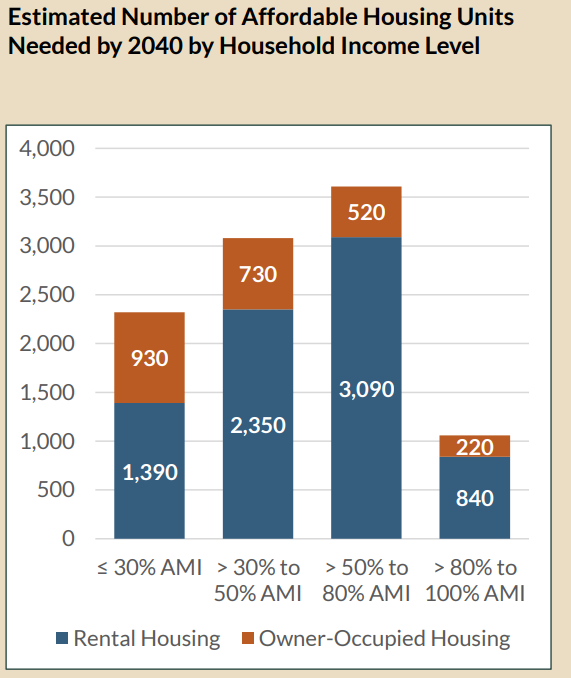
Overall, the total number of affordable housing units needed by 2040 is 10,070. Call it ten thousand.
Will it happen?
No. Here's why.
Level-Setting
First things first: what's our current inventory? According to that same report, we have 2,230 affordable homes in the county. That number is made up of subsidized rental units, proffered for-sale and for-rent units, preserved units, and bonus density units. Subsidized rental units are what most of us think of when we think affordable housing: an apartment or rental home, somehow subsidized by public dollars. That might be Low-Income Housing Tax Credits, that might be some other state or local dollars, but subsidized somehow. Proffered units are those offered up by a developer when a new development is built in the County. Up until recently, Albemarle County required a proffer of 15% of the total homes in a new development as affordable; that changed with new housing policy in recent years, which now requires 20%.
Bonus density units are similar to proffered units in that they are part of a new development; certain types of zoning allow for more density - more units per acre - if those homes are designated affordable. Preserved units are in the list too; this typically means homes that would have fallen into the market, but have been somehow kept affordable (usually by a nonprofit partner).
This might not represent all of the "affordable" housing in Albemarle. That is, there may be some housing that's just old, or small, or worn-down, or all three; any combination of factors that brings down the rent. This also doesn't include houses that may be completely paid off, or other situations where monthly housing costs are "affordable" for the owner/renter.
So: 2,230 homes counted in the current inventory of affordable housing.
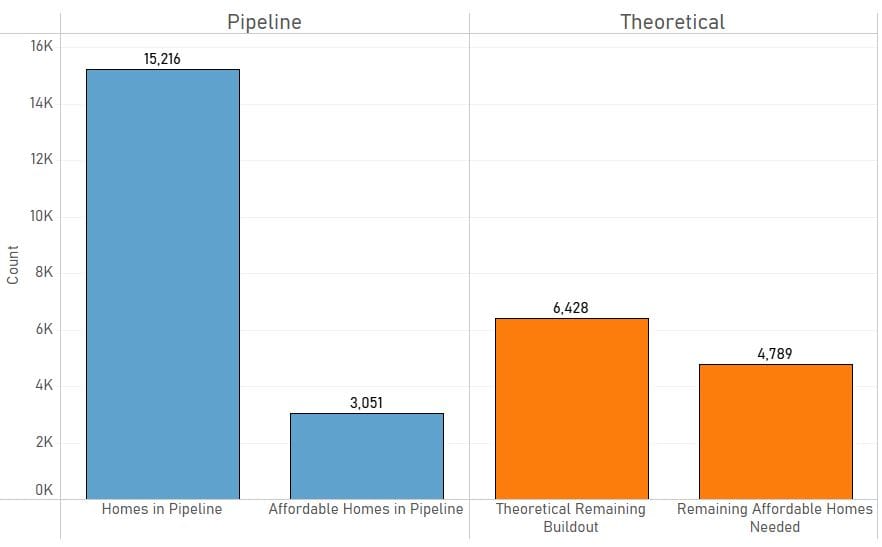
There are also 3,051 affordable homes in the development pipeline. Of those, the vast majority are proffered units - 2,113, or about 70% of pipeline affordable homes. The rest are subsidized rental homes.
This knocks our big ten thousand down by a few pegs - counting the existing affordable housing and pipeline affordable housing against the total needed, we reach 4,789 additional affordable homes needed by 2040. (This is a high-level total; the current & pipeline numbers aren't broken down by income bracket affordability, so we can only really compare at the top level).
About five thousand more affordable homes. In order to know if we're going to even approach those numbers, we need to know how many homes we're expected to build in the next fifteen years.
How Many Homes Will We Build By 2040?
Huzzah for the Land Use Buildout Analysis! It's a useful tool (and they promise to actually have a tool to use in the future, as opposed to snapshot analyses).
We're looking at the 2025 column in this little picture:
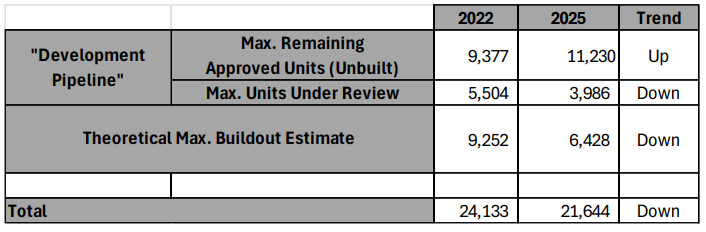
In case it's not self-evident:
- Maximum remaining approved units (unbuilt) refers to homes that have been approved through Board of Supervisors action - rezonings, special use permits, etc. - but have not yet actually been built. There are 11,230 of those homes.
- Maximum units under review refers to pending applications before the County at time of report (April 2025 - almost a year ago!) There's just under four thousand of those - 3,986 total.
- Theoretical Maximum Buildout Estimate refers to how many homes could be built on the developable acres in the development areas. There's probably a lot of math and assumptions under the hood driving this number; the analysts come up with 6,428 homes.
Annoyingly, the County doesn't have a public-facing comprehensive tracking tool for how many of those approved/pending units - the "Development Pipeline" - are proffered affordable (or bonus density, or subsidized, etc etc). We can kind of squint at the affordable housing numbers from earlier - 3,051 affordable homes in the pipeline - but those numbers aren't synced up with the land use buildout analysis, and I don't know if the affordable housing "pipeline" uses the same definition as the land use buildout "pipeline" - units approved plus units pending approval.
For now, we'll squint. 3,051 affordable homes in the pipeline. Let's assume the word pipeline means the same thing in two different places and combine the 11,230 approved units with the 3,986 pending approval - we come up with 15,216 homes in the Development Pipeline, of which 3,051 (20%) are affordable.
Of course, like we learned earlier, that leaves at minimum 4,789 more affordable homes needed by 2040 to meet population needs. If we go back to our handy-dandy Land Use Buildout, we can see that there are an estimated 6,428 further homes that could be built in the development areas, beyond our pipeline.
Out of those 6,428 homes, we need at least 4,789 to be affordable. Or, to put it another way: in order to build enough affordable housing, 75% - three out of every four homes built beyond our development pipeline - would have to be affordable housing.
Here, I visualized that:
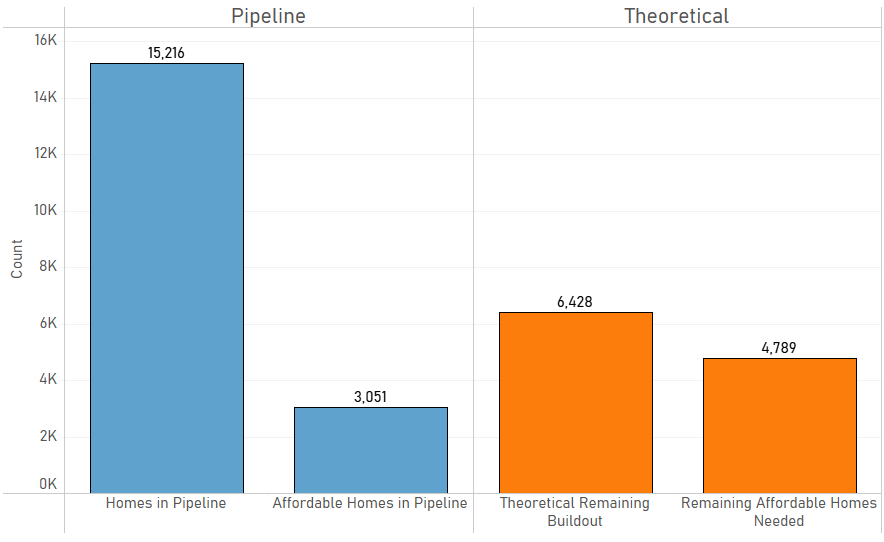
In case you can't tell: that's very likely not going to happen. Not without a a miracle...or at least, not without taking serious steps to fix our supply-side problems.
A Frustrating Mismatch
The county appears to have all the information they need. The annual housing report tells us how many homes we need available at different percentages of the Area Median Income by 2040 to serve our population. The CO reports and internal data from the Department of Community Development suggest that the County at the very least could get an idea of the rate of residential construction. The Land Use Buildout analysis tells us how much housing we can realistically expect to be built given the land we have. I recognize I've used some napkin math and assumptions in this blog post, but I feel confident I'm still playing baseball in the ballpark.
And all of this adds up to say: it's not enough! Not even close!
Every year, assessments go up. Housing prices in our area go up. The median home sale price in the County in the first quarter of 2025? Almost $550,000. I've heard a lot of demand-side explanations for this, and most of them hold some amount of water - high-income jobs driving up the AMI, remote workers with wages untethered from geography out-competing locally-based workers. I've often heard versions of what I call the "One Boomer Theory:" One wealthy boomer outbidding everyone else for a home purchase drives up assessments for nearby houses. And we're subject to the cruel tides of national trends. Right now, I'm sitting at a 4% interest rate on our mortgage. Any benefit we'd see from the appreciated equity in our ever-rising home value would be completely offset by 1) the 6%+ interest rates we're living with now and 2) the similarly-rising price of everyone else's home. Under these conditions, demand is driven by those with the cash or income to make a 6% interest rate a negligible problem.
Like I said: a lot of demand-side explanations for the affordability crisis. But I'm getting sick of being told the supply-side explanations are YIMBY pie-in-the-sky pipe dreams, or developer propaganda, or destructive gentrification. Seventy percent - seventy percent - of the possible future homes in the development areas are in the Development Pipeline already. Fifty-two percent have been approved and are just awaiting construction. Our supply will only grow less and less elastic, and inelastic supply plus consistently high demand equals price growth. The housing market may have its idiosyncrasies, but gravity still makes apples fall.
We continue to slide towards an inevitable and obvious cliff. We do not have enough developable land to just continue with our policies as they exist now and expect the magical manifestation of five to ten thousand affordable homes - let alone the specific needs of, say, two thousand homes affordable at less than 30% of the Area Median Income.
I won't pretend it's a problem that we can solve with One Weird Trick. I do believe that releasing some of our tight controls on housing supply will help. Building more housing helps. Research proves it, basic economics proves it. And, absolutely, that will require public dollars invested in infrastructure to serve all our neighbors well. We're also going to need to put public dollars towards housing. Housing vouchers are good, but we need to more aggressively subsidize housing with public money. It'd be great if we had a functioning federal government that could help with that; for now, it's up to us and the Dillon Rule commonwealth in which we live. Local housing nonprofits are great, and can help fill the gap, but they're still subject to the same tight controls on local supply as every other developer in our area.
Above all, we really need to take seriously both:
- Increasing the by-right density in development areas, allowing for more new construction without needing zoning applications, and
- Increasing the amount of developable land in the County, to include expanding the development areas.
Often, when development area expansion comes up, there's a few cautions people like to issue. Won't this just induce demand for housing? Won't this inflate the property values of the new development area land, offsetting the price decreases from increased inventory? And sure, it's true that in any approach we take, we have to be thoughtful and intentional. Sprawl is bad development; blithely fostering sprawl is bad policy.
But on a fundamental level, after walking through this data and opening my third eye, here's what I have to say to those (including my past self) who are skeptical about any development area expansion:
Where are my neighbors going to live? Where are, at minimum, the five thousand families who need affordable homes by 2040 going to live? Where are my neighbors who rely on SSDI or Social Security going to live? What homes will be built for them? Over half of renter households in Albemarle County are cost-burdened today - where will they live? Almost two-thirds of households with an income below $75k are cost-burdened - where will they live? My neighbors who work in childcare, who are cashiers, who are nursing assistants, home health workers, EMTs, bus drivers - where are my neighbors going to live? Where are my neighbors going to live?